Sunday Options
Tesla (TSLA) 10/15/19
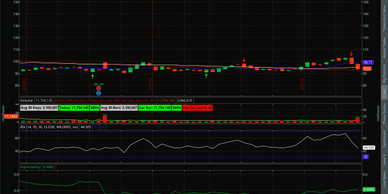
Bruker Corp (BRKR) 8/4/19
Bruker Corp (BRKR) 8/4/19
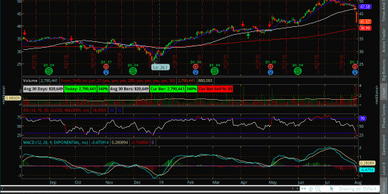
Keeping a close eye on TSLA for a possible Put option opportunity. Broke a little above the SMA 200 but was rejected by the resistance area today.
Bruker Corp (BRKR) 8/4/19
Bruker Corp (BRKR) 8/4/19
Bruker Corp (BRKR) 8/4/19
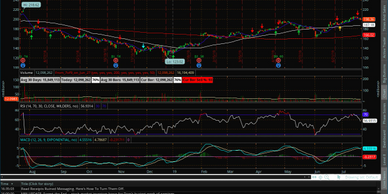
Excessive sell off after what looked to be a positive earnings report. Beating analyst estimates by 10%. Also reporting sales up 10.48% higher than the same time period last year ($490.2 million) again beating the analysts estimate of $477.79 million.
Facebook (FB) 7/21/19
Bruker Corp (BRKR) 8/4/19
Home Depot (HD) 7/21/19
Price broke and closed below the SMA 9. The next support looks like it will be around the SMA 50 at $187.18. MACD is showing signs of a downtrend as well. This could change when earnings come out on 7/24/19
Home Depot (HD) 7/21/19
Electronic Arts (EA) 7/7/19
Home Depot (HD) 7/21/19
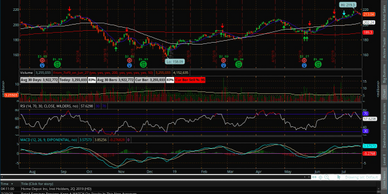
Price broke and closed below SMA 9 ($213.04). Looks to me like there is room down to the $208 area before support. MACD showing signs of a downtrend.
Philip Morris (PM) 7/14/19
Electronic Arts (EA) 7/7/19
Electronic Arts (EA) 7/7/19
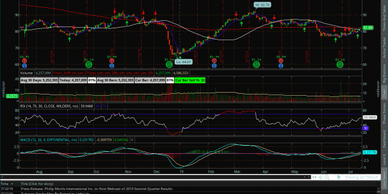
Watching PM for a cross above the SMA 180 for confirmation of an uptrend. RSI looks good sitting at 59. The MACD looks about ready to head higher. Just something to keep an eye on.
Electronic Arts (EA) 7/7/19
Electronic Arts (EA) 7/7/19
Electronic Arts (EA) 7/7/19
EA Broke and closed below the SMA 9 & SMA 50 on Friday watch Monday for potential break below the SMA 180 on 1 year chart or a reversal back upward off of the SMA 180.